Why NanoZoomer

Products
Solutions

Case study
Resources


United States (EN)
Select your region or country.
Unveiling the cellular distribution of two fluorescent receptors
Institut Clinique de la Souris (ICS) – IGBMC, Illkirch, France
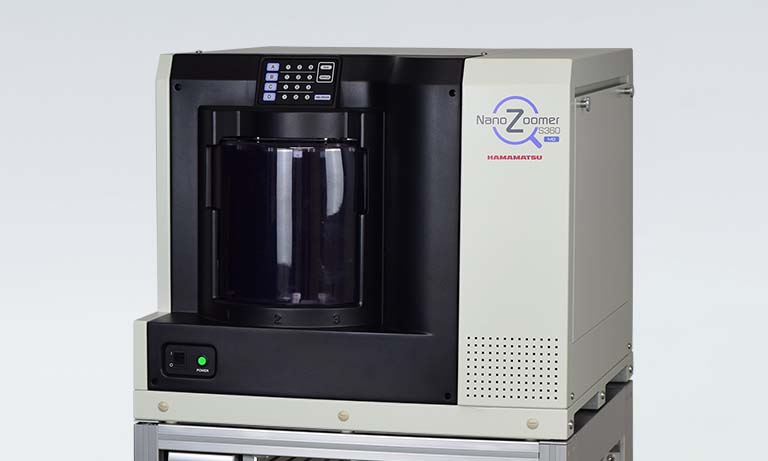
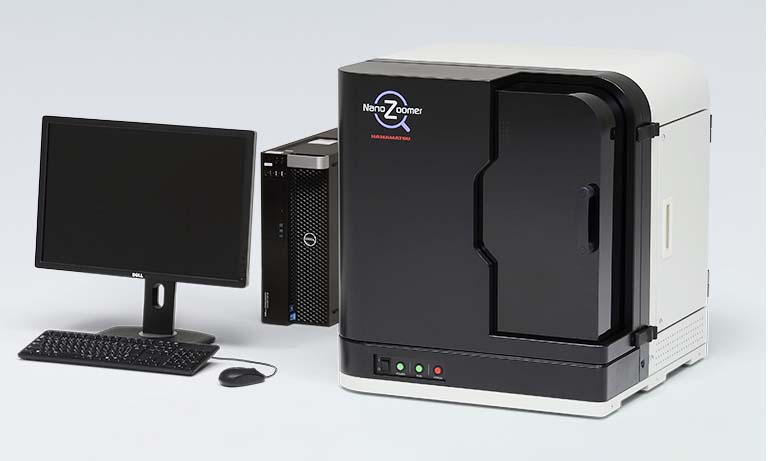
The Institutde la Clinique de la Souris (ICS) (Mouse Clinical Institute – MCI) founded in 2002 by Pierre Chambon and directed by Dr Yann Hérault provides a comprehensive set of specific services to academic and industrial users and is a major player in the European post-genomics era programs. ICS is specialized in the generation of customized and ready-to-use genetically modified mice as well as standardized, comprehensive or advanced functional characterization of mouse models. Phenotypic profi ling includes a comprehensive histopathological analysis of mutant or treated mice to detect and systematically analyze organ defects and tissue alterations at precise stages during mice development and life. The histopathology and embryology facility therefore acquired the Nanozoomer 2.0 HT, with its fluorescence module, to fulfill challenging requirements in terms of image quality, high throughput screening and interactive data management with customers.
Cellular Distribution of two fluorescent receptors in the mouse brain
Dr Dominique Massotte, Department of Neurogenetics and Translational Medicine, IGBMC, pioneered the creation of a virtual atlas presenting the distribution of two fluorescent receptors in the mouse brain, the mu and delta opioid receptors.
Opioid receptors and endogenous opioid peptides are broadly expressed throughout the nervous system. They form a complex neuromodulatory system that regulates numerous physiological functions with important involvement in pain control, mood disorders and drug abuse. Mu and delta receptors belong to the G protein-coupled receptor family that constitutes 35 % of the current drug targets on the market. Changes in mu and delta receptor functional properties have been postulated to result from their co-expression in specific neurons. However, the existence of such neurons in the brain remained controversial.
We generated genetically modified mice that express functional fluorescent versions of the mu and delta opioid receptors respectively in fusion with a red or a green fluorescent protein. In vivo fi ne cartography of the resulting bicolor double mutant line was essential to depict the distribution of the two receptors but collecting data throughout the entire brain proved instrumental to generate global maps. A fluorescent microscope, while achieving high magnification, only enable to view a small field within the sample. Therefore, reconstructing the overall distribution of the signal in an entire brain section turns out as extremely cumbersome. The Nanozoomer 2.0 HT is unique since it provides a single image of the whole tissue section with the possibility to zoom in anywhere to visualize the signal of interest with subcellular resolution. Consequently, an organ as complex as the rodent brain can be screened at high magnification for up to six different fluorescent probes simultaneously. Here, collecting images at three different wavelengths without interference and recombining them make also acquisitions with the Nanozoomer extremely valuable for fi ne immunohistochemical mapping with different specific markers (Figure 1).
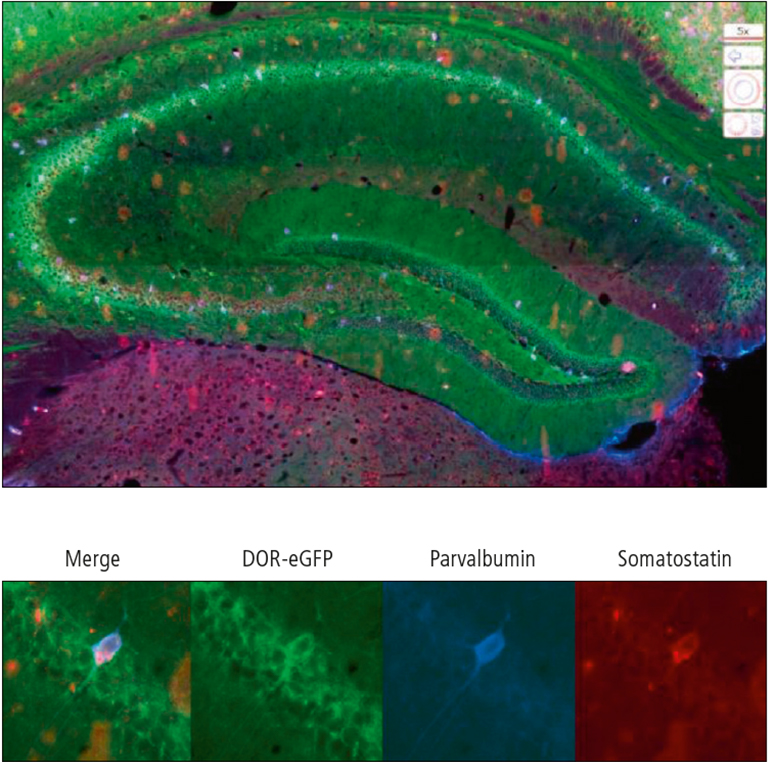
Figure 1: Identification of the neuronal subtypes expressing DOR-eGFP in the hippocampus by co-localization with specific neuronal markers. General view of the hippocampus (above) and individual neuron co-expressing DOR-eGFP, somatostatin and parvalbumin (below).the right are shown from the side.
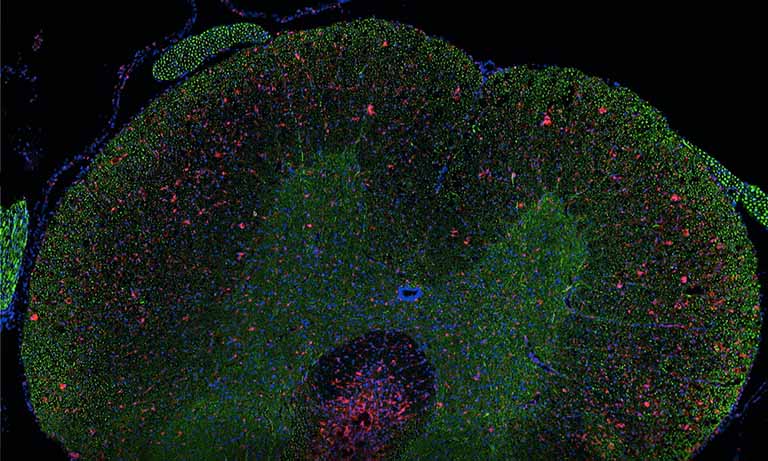
The possibility to optimize image acquisition for each fluorescent probe to take into account its actual intensity represents another major advantage. Combining the bicolor double mutant mouse line and high resolution image acquisition with the Nanozoomer (magnification 40x resolution 0.23 µm/pixel) made then possible to map the two fluorescent receptors throughout the brain and to single out neurons in which the two fluorescent signals were simultaneously present (Figure 2).
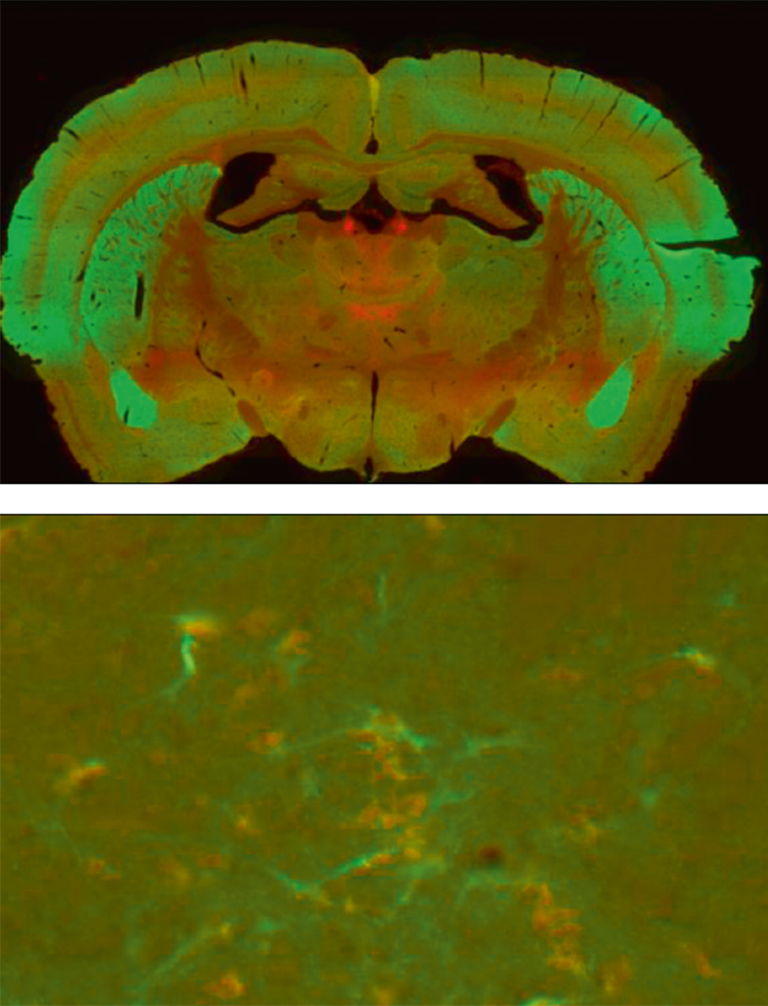
Figure 2: Brain coronal section showing the distribution of the fluorescent signals associated to DOR-eGFP (green) and MOR-mcherry (red). General overview (above) and individual neurons (below) using 40x objective.
Accessing freely to the virtual atlas
Using the NDP.Toolkit program, each image, corresponding to a single brain section could be isolated and used for integration in an interactive resource. All the images can then be accessed freely, using NDP.Serve interface, coupled with NDP.View at https://mordor.ics-mci.fr/.
Following Receptor Internalization
Another interesting application of the Nanozoomer 2.0 HT is the possibility to map brain areas where receptors get activated in response to a physiological challenge. Indeed, in vivo activation of some neuronal networks promotes endogenous opioid peptide release, that activates the receptors. Receptor stimulation in turn induces receptor relocation from the cell surface to intracellular compartments or so-called internalization. Visualization of the fluorescent receptors at subcellular resolution when acquiring images at a 40x magnification (resolution 0.23 µm/pixel) (Figure 3) led to identify brain regions in which internalization had taken place upon a given physiological challenge which represents a powerful approach to study endogenous GPCR physiology.
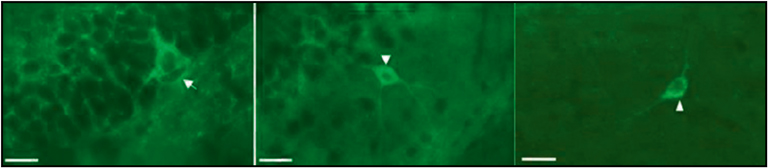
Figure 3: DOR-eGFP is present at the surface of the neuron under basal conditions (arrow, left image) and gets redistributed inside the cell upon activation. Importantly, the internalization profi le looks different after physiological activation resulting from endogenous peptide release (arrow head, central image) or pharmacological activation by the agonist SNC 80 (arrowhead, right image).es Scale bar 10 µm.
For further information see:
Faget L., Erbs E., Le Merrer J., Scherrer G., Matifas A. Noble F., Benturquia N., Kessler P., Koch M., Vonesch J.-L., Kieffer B.L. and Massotte D. (2012) “In vivo visualization of delta opioid receptors upon physiological activation uncovers a distinct profile.” J. Neurosci. 32, 7301.
Erbs E., Faget L., Scherrer G., Kessler P., Hentsch D., Vonesch J.-L., Matifas A., Kieffer B.L. and Massotte D. (2012) “Distribution of delta opioid receptor expressing neurons in the mouse hippocampus.” Neurosciences 221, 203.
Unveiling the cellular distribution of two fluorescent receptors [2.5 MB/PDF]

- Confirmation
-
It looks like you're in the . If this is not your location, please select the correct region or country below.
You're headed to Hamamatsu Photonics website for US (English). If you want to view an other country's site, the optimized information will be provided by selecting options below.
In order to use this website comfortably, we use cookies. For cookie details please see our cookie policy.
- Cookie Policy
-
This website or its third-party tools use cookies, which are necessary to its functioning and required to achieve the purposes illustrated in this cookie policy. By closing the cookie warning banner, scrolling the page, clicking a link or continuing to browse otherwise, you agree to the use of cookies.
Hamamatsu uses cookies in order to enhance your experience on our website and ensure that our website functions.
You can visit this page at any time to learn more about cookies, get the most up to date information on how we use cookies and manage your cookie settings. We will not use cookies for any purpose other than the ones stated, but please note that we reserve the right to update our cookies.
1. What are cookies?
For modern websites to work according to visitor’s expectations, they need to collect certain basic information about visitors. To do this, a site will create small text files which are placed on visitor’s devices (computer or mobile) - these files are known as cookies when you access a website. Cookies are used in order to make websites function and work efficiently. Cookies are uniquely assigned to each visitor and can only be read by a web server in the domain that issued the cookie to the visitor. Cookies cannot be used to run programs or deliver viruses to a visitor’s device.
Cookies do various jobs which make the visitor’s experience of the internet much smoother and more interactive. For instance, cookies are used to remember the visitor’s preferences on sites they visit often, to remember language preference and to help navigate between pages more efficiently. Much, though not all, of the data collected is anonymous, though some of it is designed to detect browsing patterns and approximate geographical location to improve the visitor experience.
Certain type of cookies may require the data subject’s consent before storing them on the computer.
2. What are the different types of cookies?
This website uses two types of cookies:
- First party cookies. For our website, the first party cookies are controlled and maintained by Hamamatsu. No other parties have access to these cookies.
- Third party cookies. These cookies are implemented by organizations outside Hamamatsu. We do not have access to the data in these cookies, but we use these cookies to improve the overall website experience.
3. How do we use cookies?
This website uses cookies for following purposes:
- Certain cookies are necessary for our website to function. These are strictly necessary cookies and are required to enable website access, support navigation or provide relevant content. These cookies direct you to the correct region or country, and support security and ecommerce. Strictly necessary cookies also enforce your privacy preferences. Without these strictly necessary cookies, much of our website will not function.
- Analytics cookies are used to track website usage. This data enables us to improve our website usability, performance and website administration. In our analytics cookies, we do not store any personal identifying information.
- Functionality cookies. These are used to recognize you when you return to our website. This enables us to personalize our content for you, greet you by name and remember your preferences (for example, your choice of language or region).
- These cookies record your visit to our website, the pages you have visited and the links you have followed. We will use this information to make our website and the advertising displayed on it more relevant to your interests. We may also share this information with third parties for this purpose.
Cookies help us help you. Through the use of cookies, we learn what is important to our visitors and we develop and enhance website content and functionality to support your experience. Much of our website can be accessed if cookies are disabled, however certain website functions may not work. And, we believe your current and future visits will be enhanced if cookies are enabled.
4. Which cookies do we use?
There are two ways to manage cookie preferences.
- You can set your cookie preferences on your device or in your browser.
- You can set your cookie preferences at the website level.
If you don’t want to receive cookies, you can modify your browser so that it notifies you when cookies are sent to it or you can refuse cookies altogether. You can also delete cookies that have already been set.
If you wish to restrict or block web browser cookies which are set on your device then you can do this through your browser settings; the Help function within your browser should tell you how. Alternatively, you may wish to visit www.aboutcookies.org, which contains comprehensive information on how to do this on a wide variety of desktop browsers.
5. What are Internet tags and how do we use them with cookies?
Occasionally, we may use internet tags (also known as action tags, single-pixel GIFs, clear GIFs, invisible GIFs and 1-by-1 GIFs) at this site and may deploy these tags/cookies through a third-party advertising partner or a web analytical service partner which may be located and store the respective information (including your IP-address) in a foreign country. These tags/cookies are placed on both online advertisements that bring users to this site and on different pages of this site. We use this technology to measure the visitors' responses to our sites and the effectiveness of our advertising campaigns (including how many times a page is opened and which information is consulted) as well as to evaluate your use of this website. The third-party partner or the web analytical service partner may be able to collect data about visitors to our and other sites because of these internet tags/cookies, may compose reports regarding the website’s activity for us and may provide further services which are related to the use of the website and the internet. They may provide such information to other parties if there is a legal requirement that they do so, or if they hire the other parties to process information on their behalf.
If you would like more information about web tags and cookies associated with on-line advertising or to opt-out of third-party collection of this information, please visit the Network Advertising Initiative website http://www.networkadvertising.org.
6. Analytics and Advertisement Cookies
We use third-party cookies (such as Google Analytics) to track visitors on our website, to get reports about how visitors use the website and to inform, optimize and serve ads based on someone's past visits to our website.
You may opt-out of Google Analytics cookies by the websites provided by Google:
https://tools.google.com/dlpage/gaoptout?hl=en
As provided in this Privacy Policy (Article 5), you can learn more about opt-out cookies by the website provided by Network Advertising Initiative:
http://www.networkadvertising.org
We inform you that in such case you will not be able to wholly use all functions of our website.
Close