Why NanoZoomer

Products
Solutions

Case study
Resources


United States (EN)
Select your region or country.
Tumour detection in Fluorescent Tissue Microarrays
Automation in immunohistological image processing is currently an essential technological development taking place in the clinical hunt for objective biomarkers in research and diagnostics. In cancer research one of the most important but also extreme challenges is the development of methods for the automatic separation of tumor and stroma tissue.
An important method routinely used in this context is the Tissue Microarray (TMA) technology, introduced in 1998. TMAs allow the simultaneous immunohistochemical analysis of several hundred tissues on a single slide. The manual detection of tumor regions in Tissue Microarrays is routinely based on the quantitative analysis of protein levels by pathologists or other experts. Yet manual detection is subjective, time consuming and most importantly suffers from intra and inter-observer variability.
A route to objectivity in histological tumor evaluation is automation and quantification by software routines. This will require computational methods capable of automatically identifying tumor areas and differentiating them from the stroma in a high quality microscopic image of the tissue, obtained by a virtual slide scanner.
To overcome the key problems of bright field staining caused by the objective and automatic capturing of distinct biomarker signals, we use fluorescence staining, PD Dr.-Ing. Niels Grabe, Scientific Head of the TIGA center explains. Although fluorescence helps in the quantification of individual cells, it does not per se help in differentiating tumor and stroma. Consequently fluorescence stained tissue slides are frequently counterstained with DAPI (4’6-diamidino2-phenylindole) taking the role of a conventional background stain.
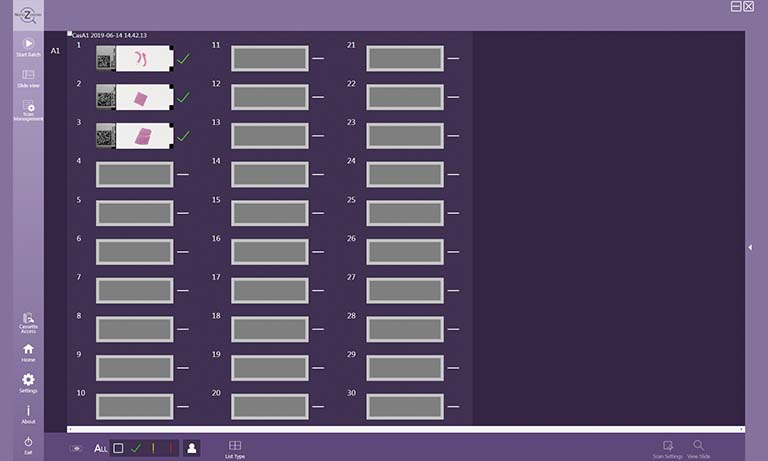
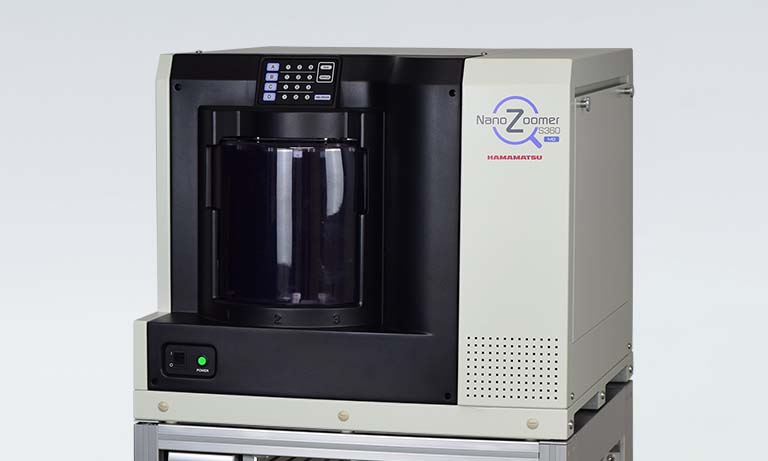
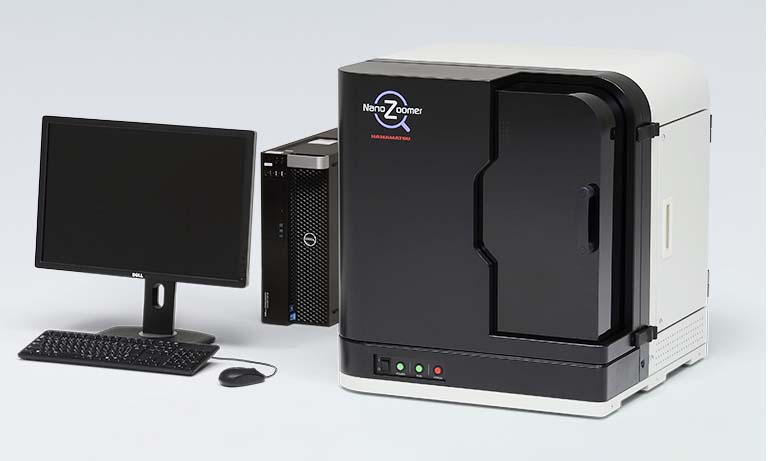
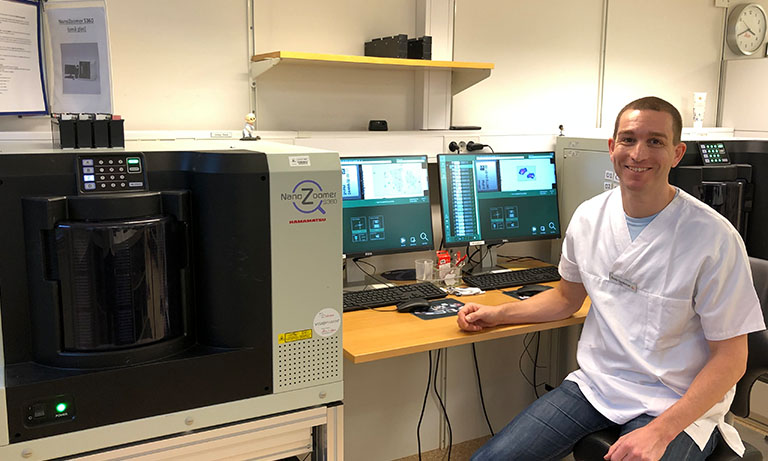
For scanning our fluorescence stained TMAs we used the NanoZoomer 2.0-HT scan system capable of scanning whole slides in high resolution Bernd Lahrmann (PhD student) tells us. Glass slides were scanned at 20x magnification (resolution of 0.46µm/pixel). The slide scanner automatically detects the region of interest that contains the array of cores and also determines automatically a valid focal plane for scanning. Single core images were located and extracted from the TMAs using template matching.
As no histological biomarker is available which would exclusively stain tumor tissue, pathology routinely uses morphological criteria as a spatial reference system. To combine the advantages of fluorescence with automatic image acquisition and processing we developed an algorithm for tumor-stroma separation and classification in immunofluorescence histological slides solely from a DAPI background stain explains Bernd Lahrmann.
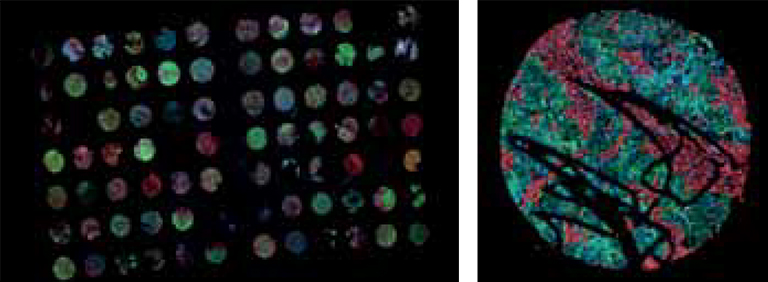
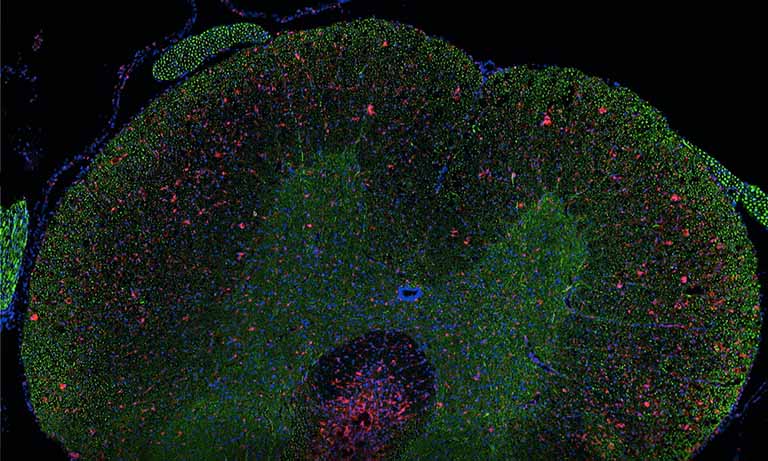
Figure 1: Microscopic Image examples of TMA slides (left) and Cores (right).
Representation of all 3 channels of a fluorescence stained core in RGB color space. Red representing stromal Marker (CK19), green the tumor marker (Vimentin) and blue the DAPI channel highlighting the cell nuclei.
Due to the restriction to a single color channel this is inherently challenging. We formed cell graphs based on the topological distribution of the tissue cell nuclei and extracted the corresponding graph features. By using topological, morphological and intensity based features we could systematically quantify and compare the discrimination capability individual features contribute to the overall algorithm. We found that when classifying fluorescence tissue slides in the DAPI channel, morphological and intensity based features clearly outpace topological ones which have been used exclusively in related previous approaches. We assembled the 15 best features to train a support vector machine based on Keratin stained tumor areas. Figure 2 shows an artificial sketch of 3 different cell types (tumor cells, lymphocytes and fibroblasts) and a cell graph representation of this sketch. Cells are depicted as nodes and the links between them represent biological relations. Cell graphs are used to train a SVM for the classification step.
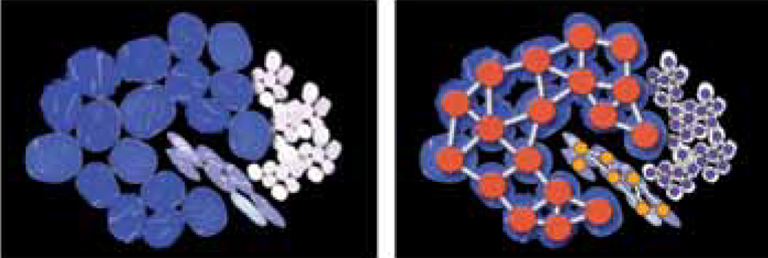
Figure 2: Conceptional representation of cell graphs.
(a) Artificial sketch of 3 different cell types: tumor cells (blue), lymphocytes (white) and fibroblast (purple). (b) Cell graph representation of (a). Cells are depicted as nodes and the links between them represent biological relations.
On a test set of TMAs with 210 cores of triple negative breast cancers our classifier was able to distinguish between tumor and stroma tissue with a total overall accuracy of 88 %. Figure 3 shows the results of the image processing steps. Cells classified as tumor in green, stroma in blue.
Our method yields first results on the discrimination capability of features groups which is essential for an automated tumor diagnostics. Also it provides an objective spatial reference system for the multiplex analysis of biomarkers in fluorescence immunohistochemistry.
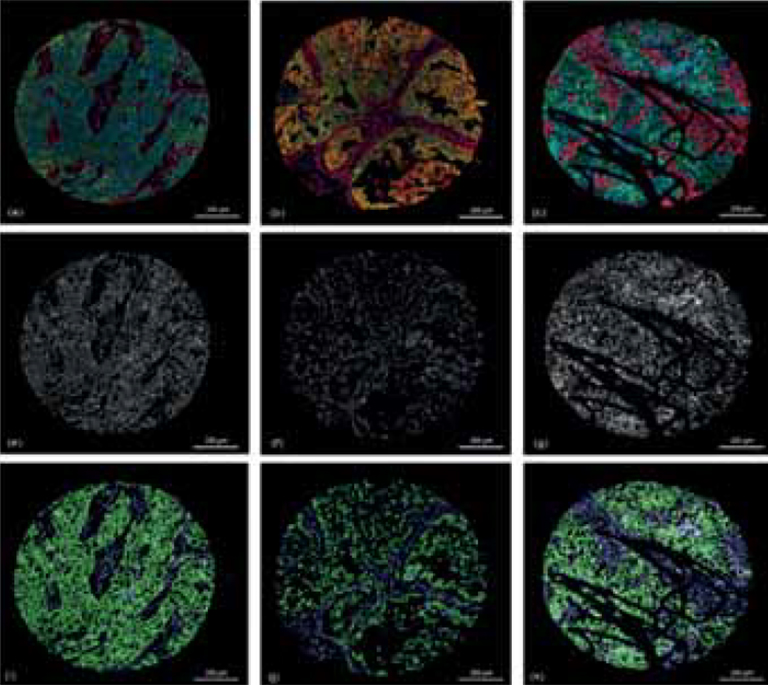
Figure 3 Results of classification.
(a-c) show the original RGB core images; (e-g) showing the corresponding DAPI channel as an intensity image of the cores (a-c); (i-k) show the results of the classification step, green = cells classified as tumor cells, blue = cells classified as stroma cells.
The TIGA Center is a cooperative project which started in 2007 at the University Heidelberg with the goal of establishing a bioinformatics platform dedicated to the quantitative analysis and modeling of tissues. A strong emphasis is placed on clinically relevant research projects.
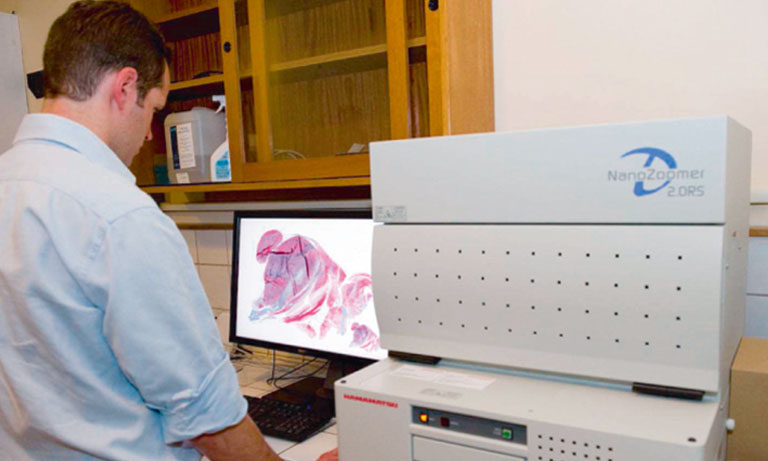
At the heart of the TIGA’s technology platform are automated microscopic scanners for whole slide imaging of glass slides. By integrating such imaging systems in a technical pipeline ranging from organotypic in vitro cell cultures to computational tissue modeling the TIGA generates a wealth of yet unexploited clinically highly relevant tissue data.
PD Dr.-Ing. Niels Grabe is the scientific head of the TIGA center, Dipl.-Bioinf. Bernd Lahrmann is PhD student in medical informatics at the TIGA center.
For further information see “Lahrmann B, Halama S, Sinn HP, Schirmacher P, Jaeger D, Grabe N. Automatic Tumor-Stroma Separation in Fluorescence TMAs Enables the Quantitative High-throughput Analysis of Multiple Cancer Biomarkers, PLoS ONE. December 2011;Vol 6(12):e28048” and http://tigacenter.bioquant.uni-heidelberg.de/

- Confirmation
-
It looks like you're in the . If this is not your location, please select the correct region or country below.
You're headed to Hamamatsu Photonics website for US (English). If you want to view an other country's site, the optimized information will be provided by selecting options below.
In order to use this website comfortably, we use cookies. For cookie details please see our cookie policy.
- Cookie Policy
-
This website or its third-party tools use cookies, which are necessary to its functioning and required to achieve the purposes illustrated in this cookie policy. By closing the cookie warning banner, scrolling the page, clicking a link or continuing to browse otherwise, you agree to the use of cookies.
Hamamatsu uses cookies in order to enhance your experience on our website and ensure that our website functions.
You can visit this page at any time to learn more about cookies, get the most up to date information on how we use cookies and manage your cookie settings. We will not use cookies for any purpose other than the ones stated, but please note that we reserve the right to update our cookies.
1. What are cookies?
For modern websites to work according to visitor’s expectations, they need to collect certain basic information about visitors. To do this, a site will create small text files which are placed on visitor’s devices (computer or mobile) - these files are known as cookies when you access a website. Cookies are used in order to make websites function and work efficiently. Cookies are uniquely assigned to each visitor and can only be read by a web server in the domain that issued the cookie to the visitor. Cookies cannot be used to run programs or deliver viruses to a visitor’s device.
Cookies do various jobs which make the visitor’s experience of the internet much smoother and more interactive. For instance, cookies are used to remember the visitor’s preferences on sites they visit often, to remember language preference and to help navigate between pages more efficiently. Much, though not all, of the data collected is anonymous, though some of it is designed to detect browsing patterns and approximate geographical location to improve the visitor experience.
Certain type of cookies may require the data subject’s consent before storing them on the computer.
2. What are the different types of cookies?
This website uses two types of cookies:
- First party cookies. For our website, the first party cookies are controlled and maintained by Hamamatsu. No other parties have access to these cookies.
- Third party cookies. These cookies are implemented by organizations outside Hamamatsu. We do not have access to the data in these cookies, but we use these cookies to improve the overall website experience.
3. How do we use cookies?
This website uses cookies for following purposes:
- Certain cookies are necessary for our website to function. These are strictly necessary cookies and are required to enable website access, support navigation or provide relevant content. These cookies direct you to the correct region or country, and support security and ecommerce. Strictly necessary cookies also enforce your privacy preferences. Without these strictly necessary cookies, much of our website will not function.
- Analytics cookies are used to track website usage. This data enables us to improve our website usability, performance and website administration. In our analytics cookies, we do not store any personal identifying information.
- Functionality cookies. These are used to recognize you when you return to our website. This enables us to personalize our content for you, greet you by name and remember your preferences (for example, your choice of language or region).
- These cookies record your visit to our website, the pages you have visited and the links you have followed. We will use this information to make our website and the advertising displayed on it more relevant to your interests. We may also share this information with third parties for this purpose.
Cookies help us help you. Through the use of cookies, we learn what is important to our visitors and we develop and enhance website content and functionality to support your experience. Much of our website can be accessed if cookies are disabled, however certain website functions may not work. And, we believe your current and future visits will be enhanced if cookies are enabled.
4. Which cookies do we use?
There are two ways to manage cookie preferences.
- You can set your cookie preferences on your device or in your browser.
- You can set your cookie preferences at the website level.
If you don’t want to receive cookies, you can modify your browser so that it notifies you when cookies are sent to it or you can refuse cookies altogether. You can also delete cookies that have already been set.
If you wish to restrict or block web browser cookies which are set on your device then you can do this through your browser settings; the Help function within your browser should tell you how. Alternatively, you may wish to visit www.aboutcookies.org, which contains comprehensive information on how to do this on a wide variety of desktop browsers.
5. What are Internet tags and how do we use them with cookies?
Occasionally, we may use internet tags (also known as action tags, single-pixel GIFs, clear GIFs, invisible GIFs and 1-by-1 GIFs) at this site and may deploy these tags/cookies through a third-party advertising partner or a web analytical service partner which may be located and store the respective information (including your IP-address) in a foreign country. These tags/cookies are placed on both online advertisements that bring users to this site and on different pages of this site. We use this technology to measure the visitors' responses to our sites and the effectiveness of our advertising campaigns (including how many times a page is opened and which information is consulted) as well as to evaluate your use of this website. The third-party partner or the web analytical service partner may be able to collect data about visitors to our and other sites because of these internet tags/cookies, may compose reports regarding the website’s activity for us and may provide further services which are related to the use of the website and the internet. They may provide such information to other parties if there is a legal requirement that they do so, or if they hire the other parties to process information on their behalf.
If you would like more information about web tags and cookies associated with on-line advertising or to opt-out of third-party collection of this information, please visit the Network Advertising Initiative website http://www.networkadvertising.org.
6. Analytics and Advertisement Cookies
We use third-party cookies (such as Google Analytics) to track visitors on our website, to get reports about how visitors use the website and to inform, optimize and serve ads based on someone's past visits to our website.
You may opt-out of Google Analytics cookies by the websites provided by Google:
https://tools.google.com/dlpage/gaoptout?hl=en
As provided in this Privacy Policy (Article 5), you can learn more about opt-out cookies by the website provided by Network Advertising Initiative:
http://www.networkadvertising.org
We inform you that in such case you will not be able to wholly use all functions of our website.
Close